Threading In Containers
Introduction
Previously I attempted to peel away the layers of abstraction for what a hardware thread is and how it maps to an operating systems and finally what were the kernel technologies that tied all of this together. I wanted to dive deeper into how the kernel views this entire process for a kubernetes pod so let’s get into it.
CPU Resources on Containers and Kubernetes
In Kubernetes the resource blocks allows you to set the request and limit of the CPU resources, this is implemented by Linux CPU Quota Subsystem within CFS.
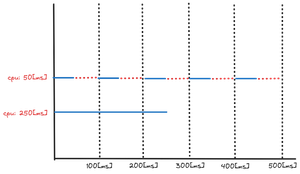
Imagine a single threaded process that takes 250[ms] to complete with no limits on the CPU, will finish within the first 250[ms] but if the same process is now configured with a pod resource block of limitscpu: 50[ms] it could take up to 450[ms] to complete. This is what is known as cpu throttling. This can be illustrated as follows.
This is a very high level representation of how throttling works the internal mechanics are far more complex, so let’s take a deeper dive into the way the kernel scheduler works and see if we can learn something.
Scheduling CPU Cores
Scheduling cgroups in CFS requires us to think in terms of time slices instead of processor counts. . Each container is isolated into its own cgroup. From the docs.
The bandwidth allowed for a group is specified using a quota and period. Within each given “period” (microseconds), a task group is allocated up to “quota” microseconds of CPU time. That quota is assigned to per-cpu run queues in slices as threads in the cgroup become runnable. Once all quota has been assigned any additional requests for quota will result in those threads being throttled. Throttled threads will not be able to run again until the next period when the quota is replenished.
Let’s take an example yaml for resource allocation.
resources:
  requests:
    memory: "64Mi"
    cpu: "1"
  limits:
    memory: "128Mi"
    cpu: "4"
Requests
The resources.requests.cpu attribute is mapped to the cgroup concept of cpu shares.
Shares is a relative number of shares (default 1024) you have given a particular process, the amount of cpu time you get for a particular process is proportional for all containers on that node.
For example, if I configure 250m (millicores) or 0.250 cores, for my CPU requests Kubernetes will set 1024 * 250 / 1000= 256 CPU shares. In our example we have resource.requests.cpu = 1 so the number of shares is 1024*1 = 1024 [shares].
The CPU shares determine the amount of time a pod can schedule time on a core. This is a soft limit or a minimum value of cpu cores that is assured to the pod when deployed to a node. Described by this formula.

Share values for a docker container can be found in /sys/fs/cgroup/${CGROUP_NAME}/user.slice/${CONATAINER_ID}/cpu.shares
If you are confused by this formula lets exemplify. Let’s imagine we have one node with 128 cores for an AI workload. The yaml file deployed on a machine such as this can be visualized as follows.
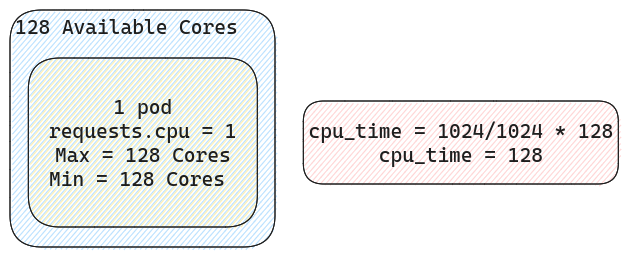
So if there is only one pod on the node and that pod is requesting 1[cpu] that translates to roughly 1024[shares]. Since it’s the only pod on the node it stands to reason that it can use all the CPUs should it need to. Now let’s add a second pod with the same resource requests.
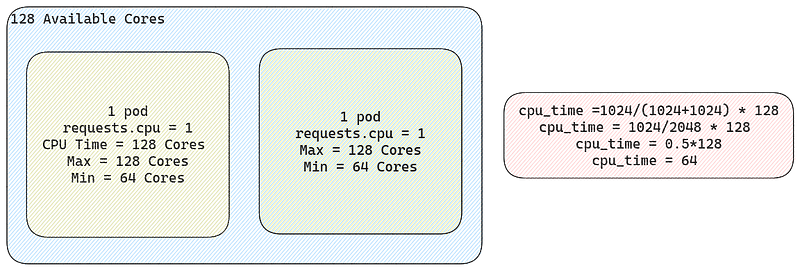
So here we can see that if we request 1 CPU for another pod , we can use at minimum 64 cores, and can grow to use all 128 cores depending on load. Now finally if we add a third pod with double the resource requirements relative to the other two.
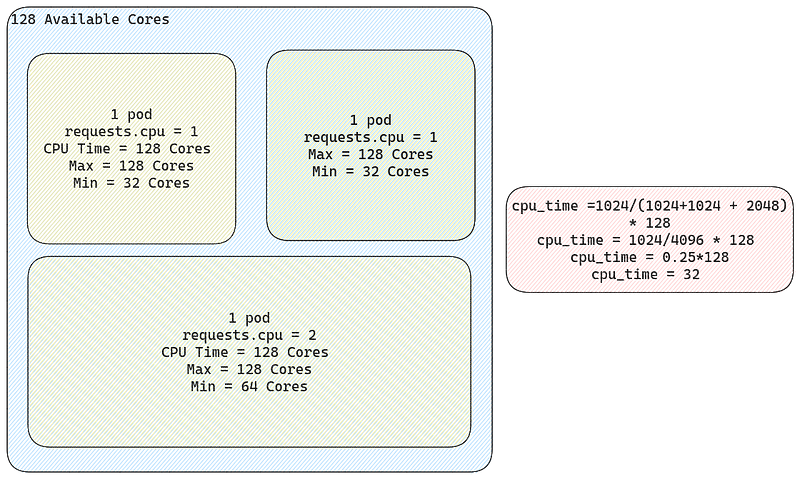
As you can see the minimum amount of cores available for the first pod, diminishes the more the number of shares that are being required by other pods increases (128→64→32). This is a relative number, as 1 share doesn’t really mean anything, it’s just a comparable value to create a proportion.
Limits
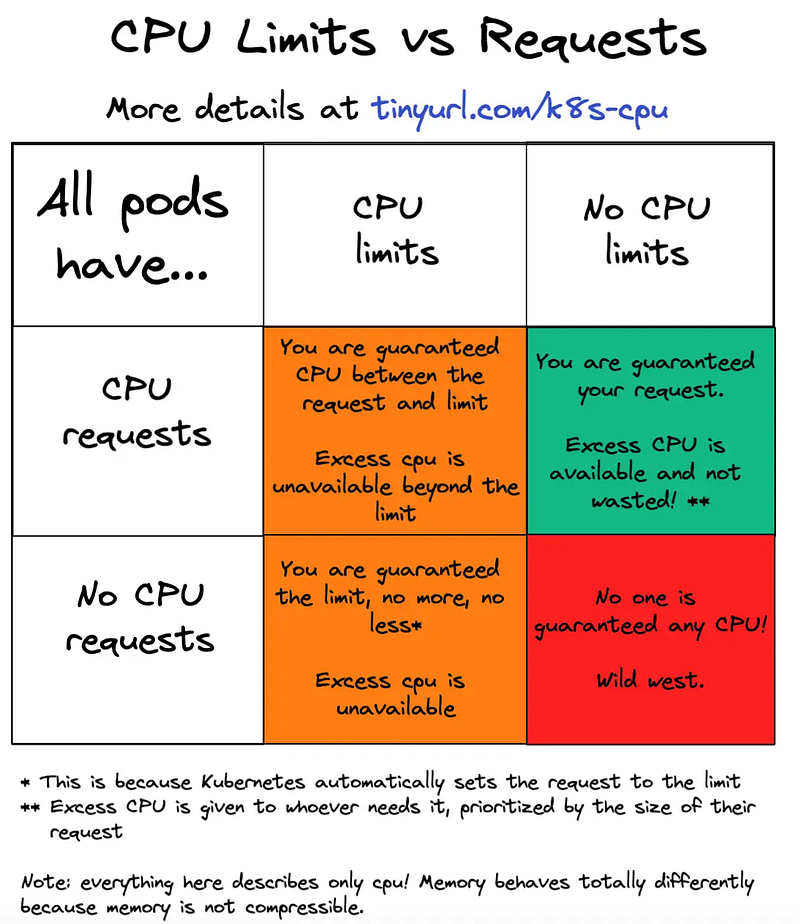
Limits is mapped to the concept of quotas in cgroups. resource.limits.cpu. This is the value that is often related to cpu throttling. This is a hard limit or a maximum value of cpu cores that is assured to the pod when deployed to a node.
A common misconception is that people believe process get assigned a physical core but the truth is that the limit is applied in the time domain, no in the number of available CPUs to the container. There is an argument to be made to avoid using limits on CPU altogether and just secure the minimum via requests, this post illustrates this argument better than I ever could.
Metrics
The metrics to scan if you want to see throttling can be found in any cgroup folder and is stored in the file cpu.stat . Almost all monitoring and observability solutions know where this is located and can scrape this automatically, but if you wanted to know where they go look for it, this would be it ¯\(ツ)/¯.
The more relevant items here is :
throttled_time which is the sum total time a thread in a cgroup was throttled. This metric is relative to the number of threads so by itself it is pretty much useless. If one thread is throttled by 10[ms] then throttled_time = 10[ms] but if your pod has 100 threads and each is throttled by the same 10[ms] then throttled_time = 1000[ms] = 1[sec]. The real useful metric would be how much is each thread being throttled by.
nr_periods is the number of periods the application was in a running state, so this means it wasn’t blocked on I/O (disk or network)
nr_throttled is the number of nr_periods the application was throttled.
These metrics actually give us a much better representation and is more agnostic on of how much our pod is being throttled. You can calculate the percentage of throttling by the formula.

Time Slices
From the docs.
A group’s unassigned quota is globally tracked, being refreshed back tocfs_quotaunits at each period boundary. As threads consume this bandwidth it is transferred to cpu-local "silos" on a demand basis. The amount transferred within each of these updates is tunable and described as the "slice". This is tunable via procfs:/proc/sys/kernel/sched_cfs_bandwidth_slice_us (default=5ms)Larger slice values will reduce transfer overheads, while smaller values allow for more fine-grained consumption.
In plain English, what this means is that a slice is how much we can transfer from a global quota within a period. Also if you read carefully the kernel documentation we can see that the time slices get assigned to a CPU.
We know that if we have 1CPU worth of quota, the period is 100[ms] and the time slice is 5[ms] ,we can have 20 [slices/period].

What this implies is that if you have over a machine with 32 cores and a slice can only be assigned to a core at maximum throughput, only 20 of those 32 cores can be doing work at peak time. This does not mean that the scheduler will discard for all time, the remaining 12 cpus, it just means that under extreme load, only 20 cpus at most can be selected for execution at any given period and tthe other 12 cores remain idle for that period. If your machine has over 20 cores then, by looking at the formula, you can either increase the period from 100[ms] or decrease the time slice from 5[ms].
Period
According to the docs
The bandwidth allowed for a group is specified using a quota and period. Within each given “period” (microseconds), a task group is allocated up to “quota” microseconds of CPU time. That quota is assigned to per-cpu run queues in slices as threads in the cgroup become runnable. Once all quota has been assigned any additional requests for quota will result in those threads being throttled. Throttled threads will not be able to run again until the next period when the quota is replenished.\
In layman’s terms there is a global quota that can offload it’s values into each individual CPUs callPer-Cpu-Quota, This quota will expire if not used within a period. The per-cpu quota is only as big as the time slice.
A visual representation of this quota on a 100[ms] period with a global quota starting at 35[ms] and time slices of 5[ms] , with two CPU quotas (CPU1 and CPU2) and all time slices assigned to either CPU1 or CPU2 can be seen below.
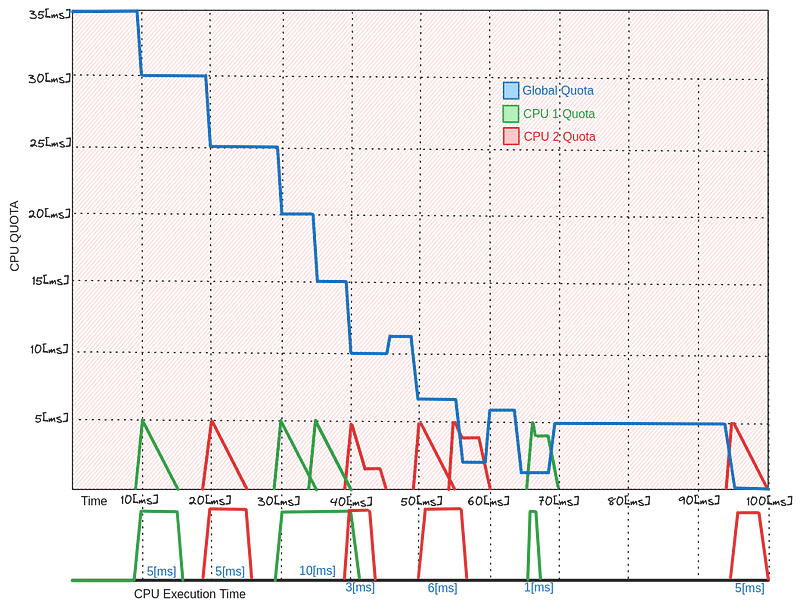
From here we can see that global quota starts at 35[ms] at t=0, when CPU 1 wants to run a thread, it borrows from the global cpu quota at t=10[ms] and adds it to it’s own CPU1 quota (green), since the time slice is 5[ms] then it can only run that particular thread for 5[ms] at most ending execution on t=15[ms], if the thread execution time is 5[ms] for that thread, then it will consume the entire CPU1 quota and wait for the next time slice.
The next thread doesn’t necessarily have to run on CPU1, it can be scheduled to run on CPU2 and the same process happens but for CPU2. This process is pretty much self evident when the time slice = execution time, but if we try to run a 3[ms] thread things get a bit more complex, since the time slice is 5[ms], the cpu quota that can be borrowed is 5[ms], execution will run for 3[ms] and the left over 2[ms] is returned to the global quota.
This is a known cause of bugs and the process in in of itself is more complicated than this but it’s a good high level approach to understanding it. Also note that in every 5[ms] interval (time slice) only one thread is running on any of the two CPUs.
A further study of the graph might trigger the question of, if I have more threads will that consume the global quota faster? If the threads are doing more CPU bound work will that trigger cpu throttling? An example of such an intensive CPU workload can be seen below.
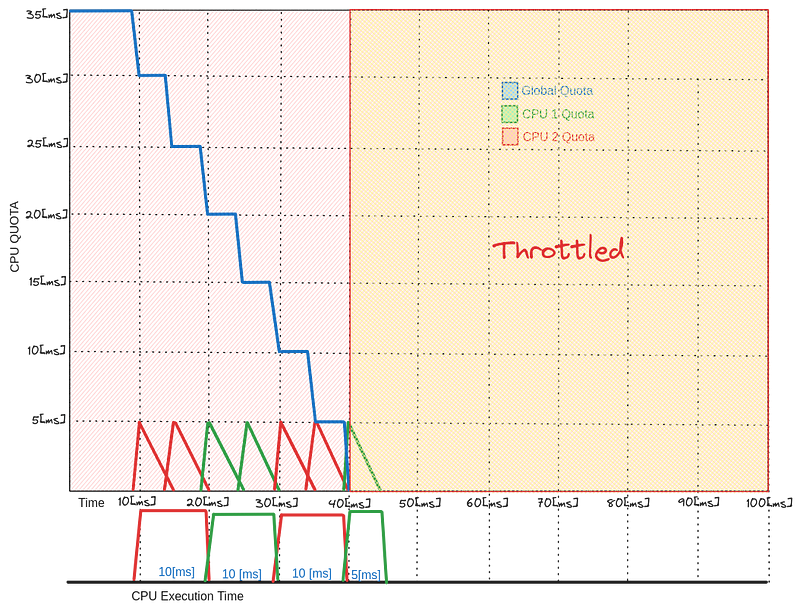
From here we can deduce that if the thread starts executing CPU intensive load, it will drain the global quota faster, and if the quota is burned then the cgroup is throttled. Analogously, if the thread pool grows in size it will schedule more threads to run and thus draining the global quotas just as fast. This is the internal mechanics of why limiting the CPU is not a good idea, and why adding more threads to a rate limited container doesn’t increase performance but rather hinders it.
Different languages map the threads differently, for example Java tends to use asynchronous worker threads and assigns one per core. Pauses in garbage collection duration time is something to watch when being throttled on a jvm. Failing liveness/readiness checks failure due to throttling and the pod no able to respond to these checks can cause the pod to be restarted by kublet. This is another problem to watch out for when adding limits to your containers.
Conclusion
We finally go to the very kernel itself to see how CPU is managed on containers. Understanding this concept as well as the type of workloads your application execute will hopefully give you a clear understanding of what to be aware when seeing the profiling metrics of your application and the caveats of adding limits or no limits. There isn’t a silver bullet for this as every application has different requirements but after this read, you will have a clear mental image of what the instructions under the hood looks like.

